Coronal Plane Perturbation Mechanism
December 6, 2016
Introduction
Human joint stiffness results from passive tissues that cross the joint and muscle-activated mechanics, which is what happens when people co-contract. Characterizing these properties in the human ankle for the coronal plane is important for us.
The Neurobionics Lab at the Rehabilitation Institute of Chicago has a high performance actuator mounted to a Biodex chair, and aims to develop an attachment that could be used to test in the coronal plane (ankle inversion / eversion axis).
This project involves the mechanical design of such attachment mentioned before, measuring the stiffness in the human ankle with it and doing system identification analyses via Matlab.
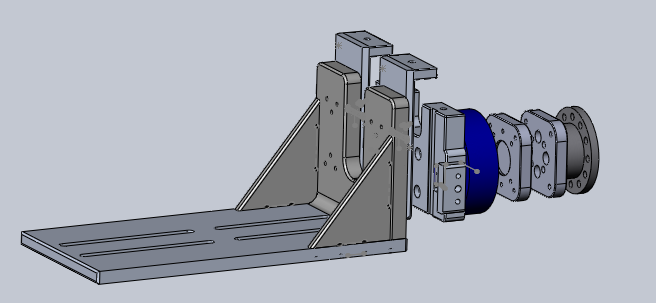
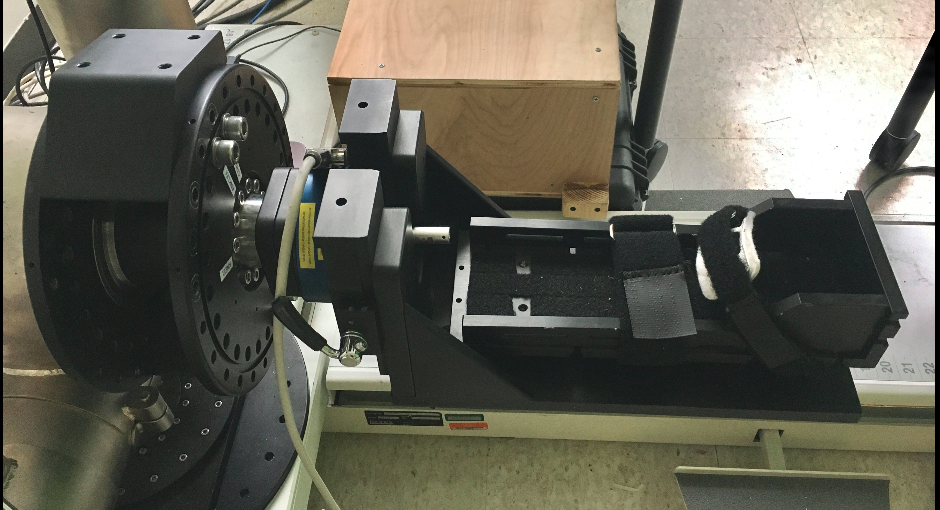
Mechanical Design
This attachment is assembled to the Biodex chair and used for testing in the coronal plane.
Simulation & System identification analysis
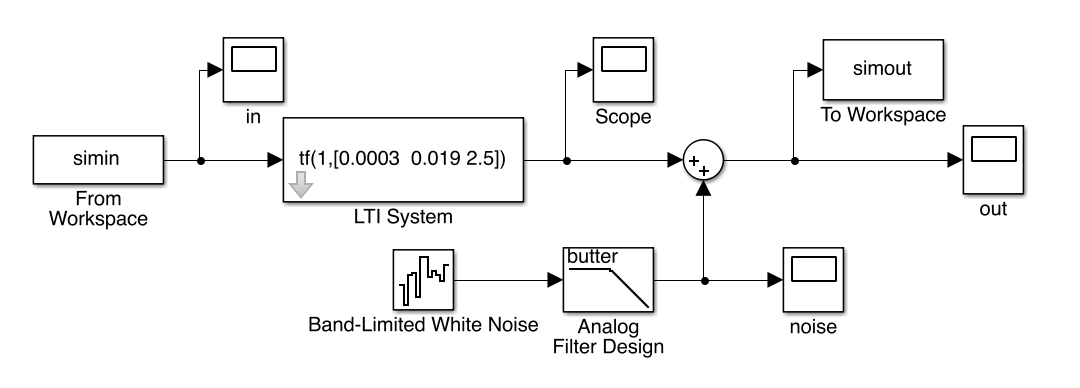
Human ankle impedance system was modeled as a second order linear time-invariant system.
The position input was filtered Gaussian white noise input with an amplitude of 1 rad, filtered using 4th-order Butterworth low-pass filter with 20-Hz cutoff frequency, and a total time of 5 seconds. The simulation sample frequency was 2000 Hz. Noise, which was also filtered using a low-pass filter with 20-Hz cutoff frequency, was added to the output data to more accurately simulate a real system. The signal to noise ratio was set to be higher than 10. Torque as output data was collected. Torque as output data was collected.
Correlation Analysis
The correlation analysis method uses the cross correlation between the input and output signals as an estimation of the impulse response, as shown by the following equation:
![]()
u(k) is the input of the system, y(k) is the output of the system, e(k) is the disturbance, h(k) is the impulse response.
The input signal must be white noise. This method reduces the impact of noise since noise is independant.
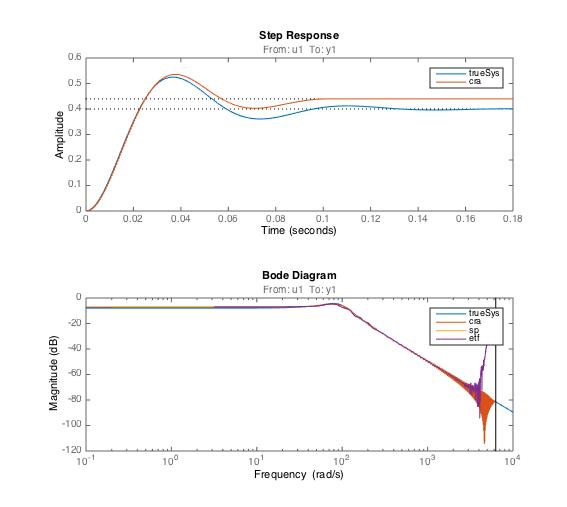
Nonparametric System Identification
Impulse response was identified with Matlab function: cra (Correlation Analysis)
Frequency response was identified with Matlab function: spa & etfe
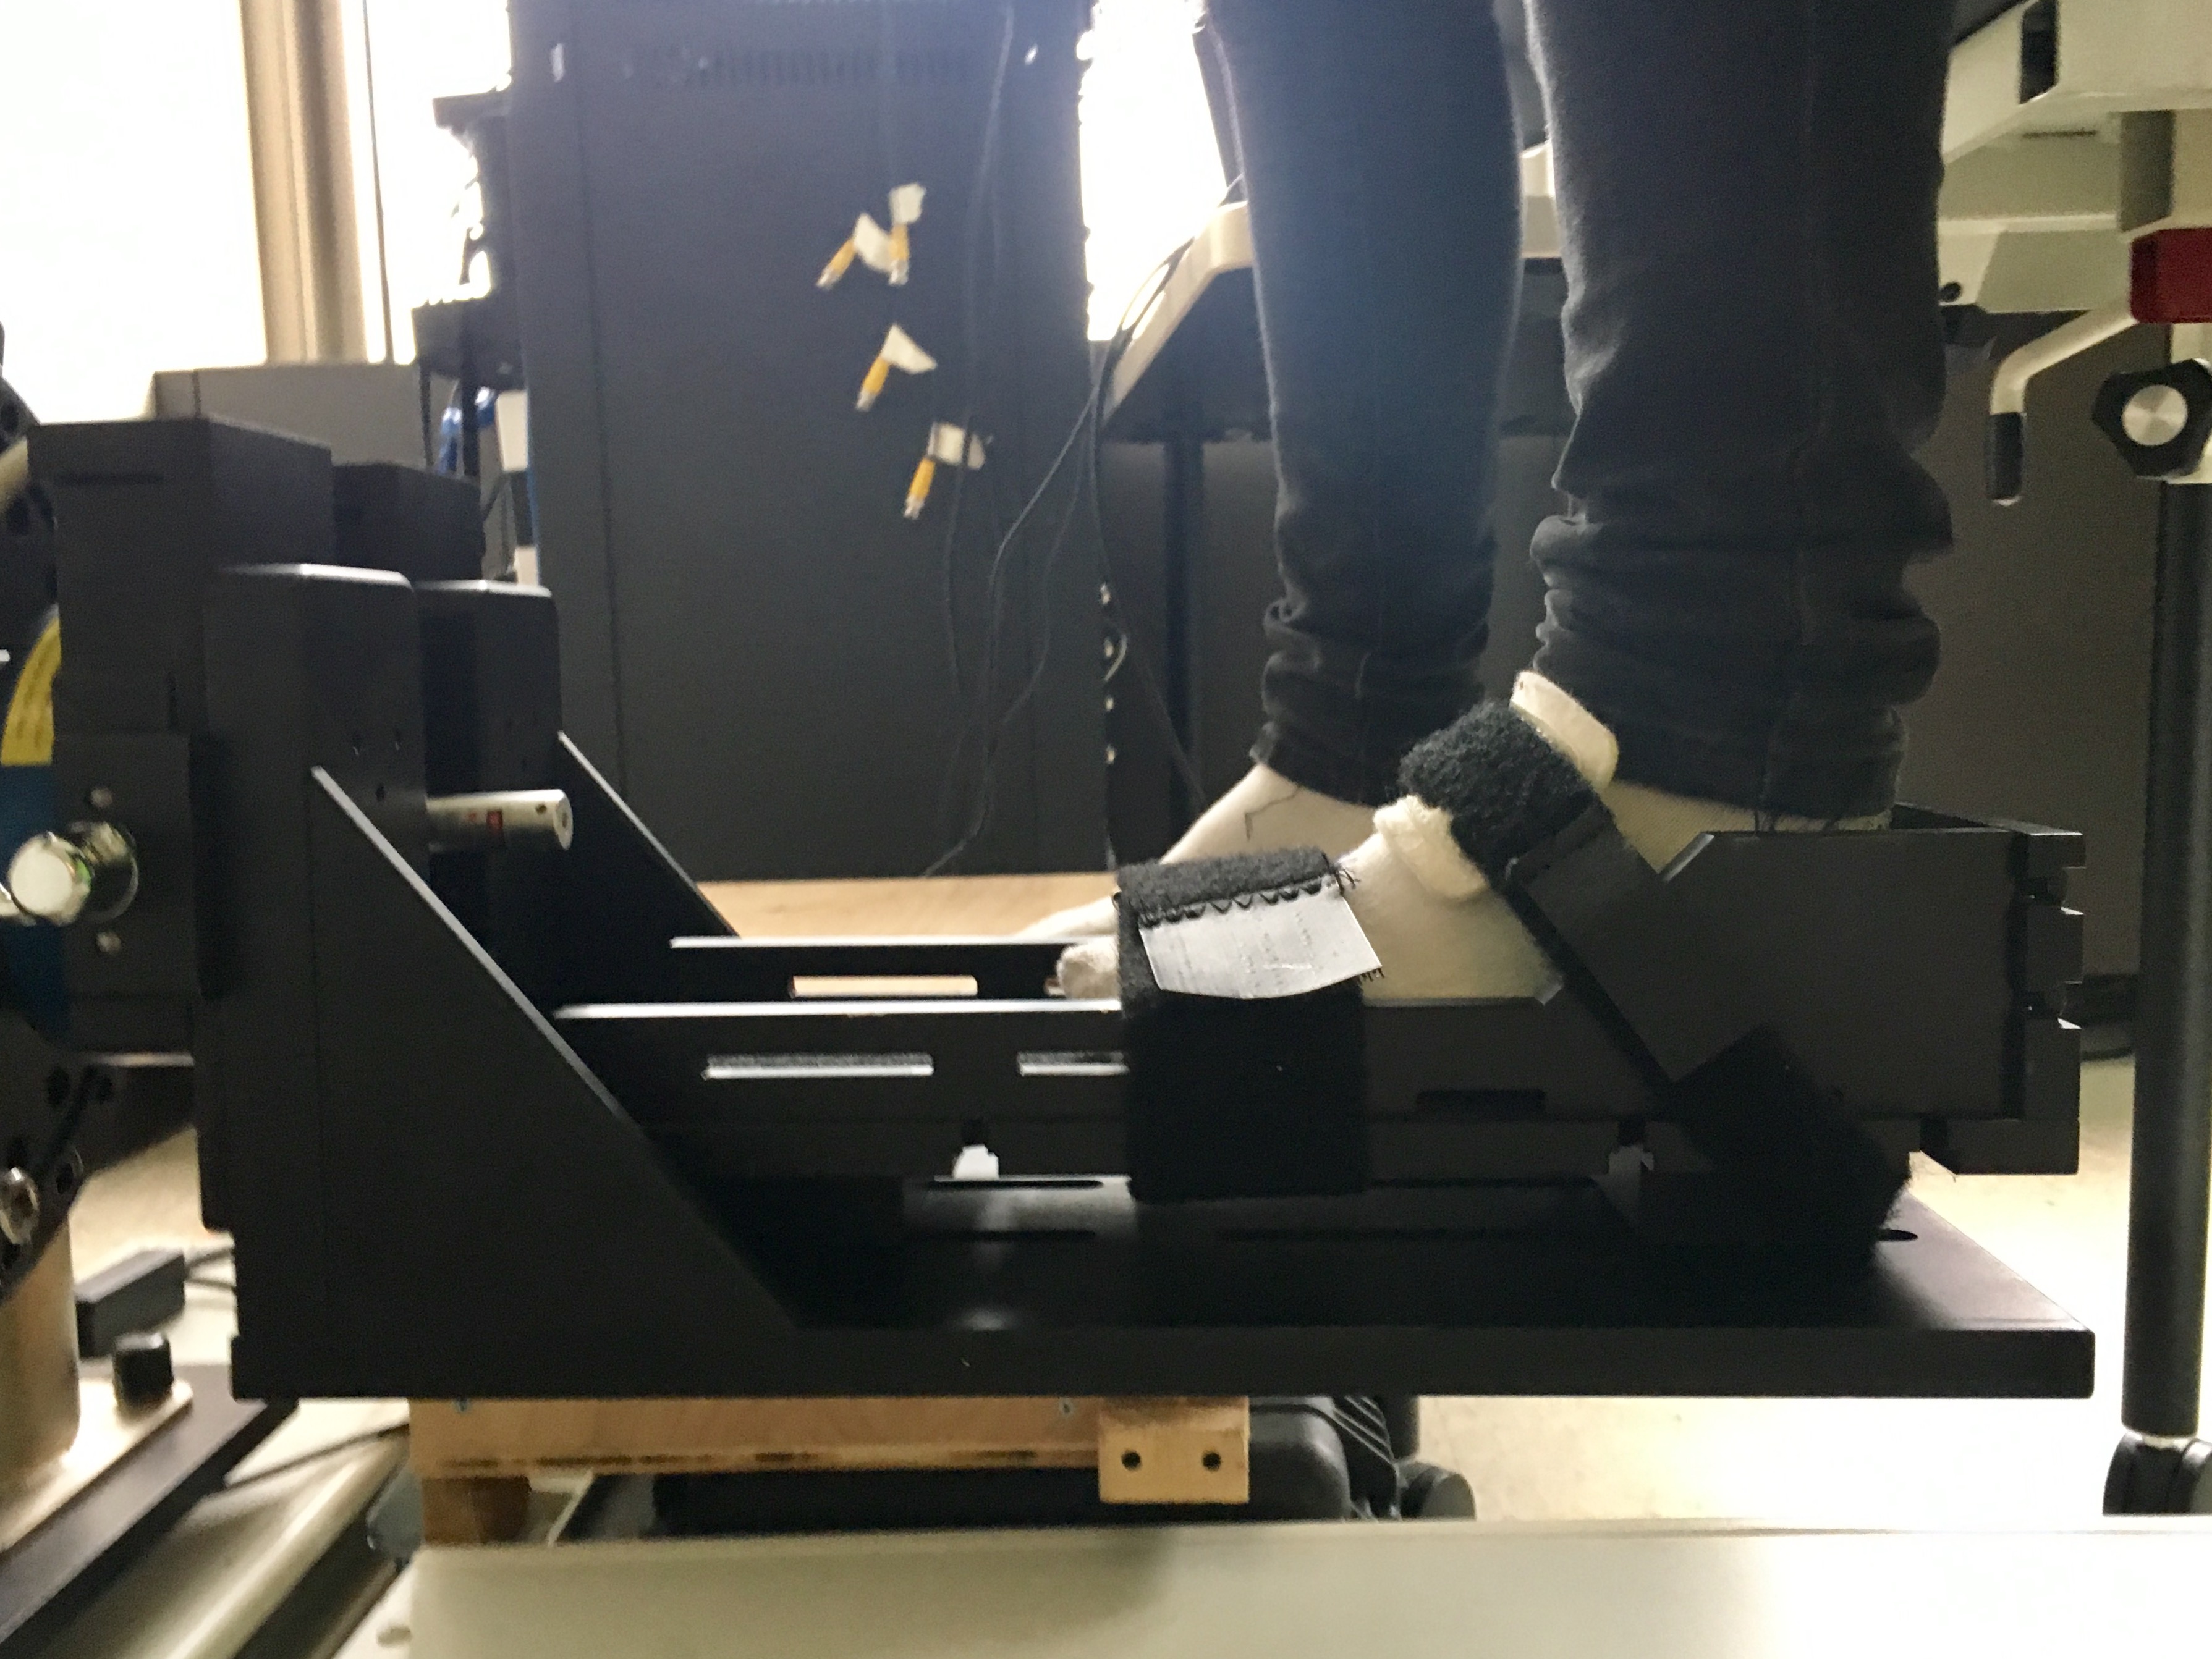
Torque Measurement
All data were collected from a single subject. The apparatus has been described previously. In summary, the subject was seated comfortably with the trunk secured to a Biodex chair. The left foot was positioned on the machine attachment and the right one was on a plane with the same height. The axis of rotation of the motor was aligned with the ankle inversion / eversion axis.
The position input was filtered Gaussian white noise input with an amplitude of 0.0175 rad, filtered using 4th-order Butterworth low-pass filter with 5-Hz cutoff frequency, and a total time of 45 seconds. All the data were collected at the sample rate of 2500 Hz. Torque as output data was collected. The maximum voluntary contraction (MVC) of the subject was 138.2622N.
There were five conditions which desgined to achieve different mean torque by asking the subject to hold different contraction and each of them had three trails in this experiment:
- No subject on the machine
- A subject with no contraction
- A subject with 30% of MVC
- A subject with 50% of MVC
- A subject with 70% of MVC
Data Analysis
Data which was from the condition that there was no subject on the machine was used to estimate the contribution of the machine to the output and would be removed.
The machine is modeled as a mapping from acceleration to torque. The impulse response of the machine dynamics was estimated using the 8~12 seconds of data. For the most accurate result, the entire 45 second recording period would be used.
This identified impulse response is used to predict the machine torque by convolving the acceleration with the machine impulse response and subtracting out this contributed torque. The remaining torque is used to characterize the system.
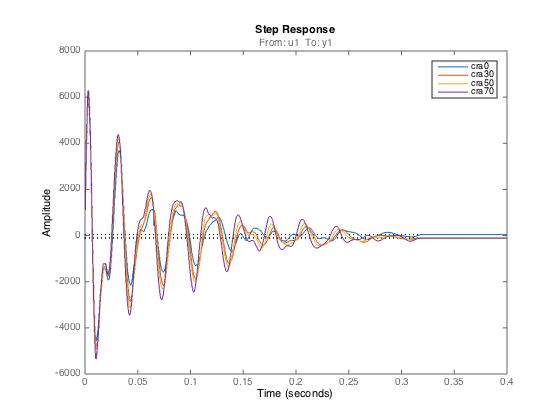
Impulse response was identified with Matlab function: cra (Correlation Analysis)
Frequency response was identified with Matlab function: spa & etfe
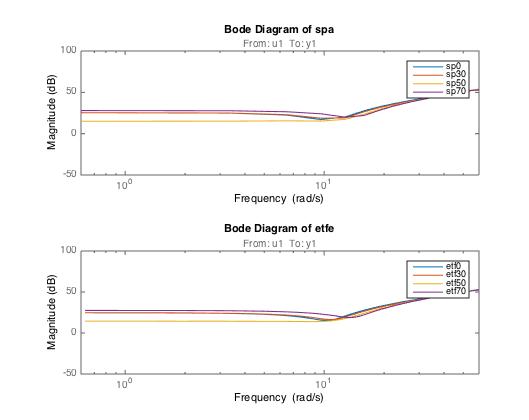
It could be seen that stiffness gain was flat at low frequencies, had a resonant valley at intermediate frequencies and rose at high frequencies. Increases in the mean torque shifted the low-frequency gain curve while the resonant point moved to a higher frequency. The inertial which was the slope of the frequency response almost kept constant over a wide range of mean torques.
The stiffness was determined from the intercept of the frequency response and the magnitude axis, since the value of the magnitude of the frequency response function for small is log(1/k), k is stiffness.
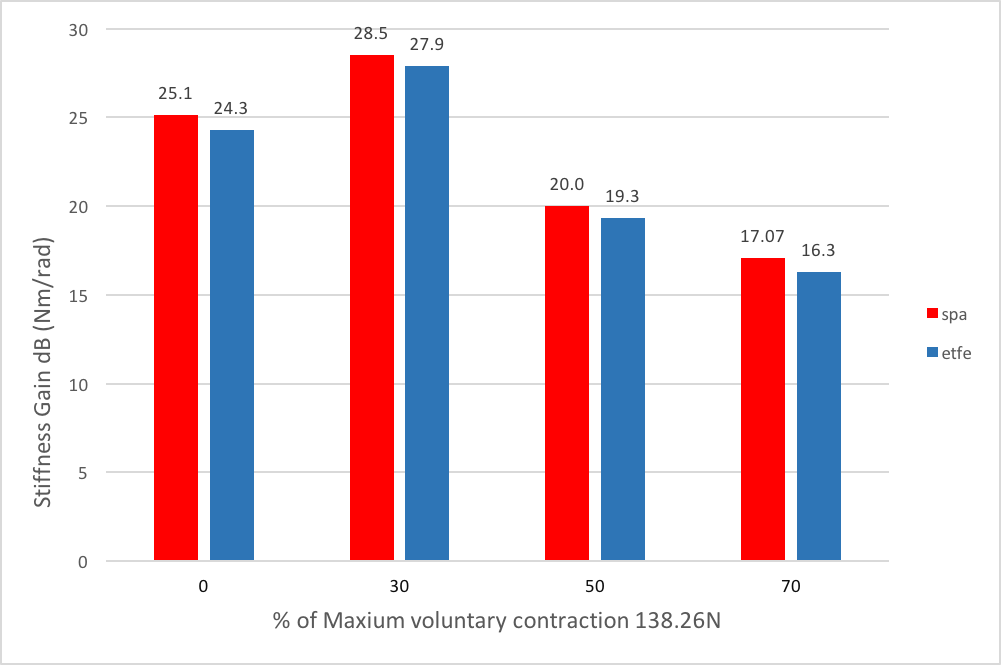
It could be seen that human ankle stiffness increased with the increase of mean torque within a limited range and then decreased.
Conclusion
This project designed an attachment to achieve testing human ankle impedance in the coronal plane. From the data analysis, it has shown that uman ankle stiffness increased with the increase of mean torque within a limited range and then decreased. In the future, this attachment can be extended to do parametric analysis in the parameters of human ankle impedance, such as inertia, stiffness and damping.